The Keeling Curve is back, after a brief volcanic interlude.
The world’s longest-running measurement of changes in carbon
dioxide in the atmosphere is collected at a small observatory some 11,000 feet
high on the slopes of Mauna Loa. It’s been tracking the changes since 1958,
when Charles Keeling started taking the measurements.
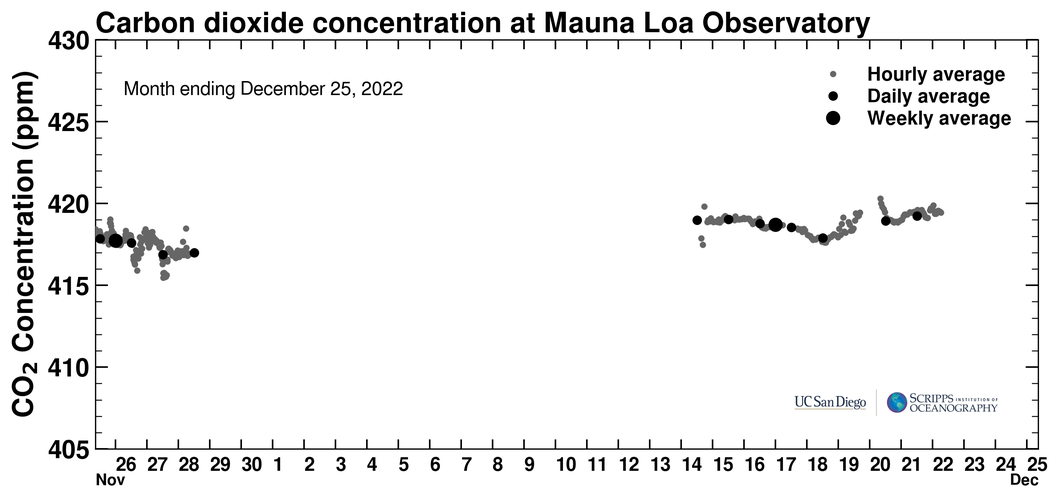
The 2022 eruption of Mauna Loa sent a flow across the
observatory access road and interrupted the Mauna Loa Observatory’s ability to
operate on November 29. As the lava cooled, service was restored in mid-December.

(Images: The top image for the past month shows the interruption in the data. The image immediately above shows the full Keeling Curve, since 1958. Both are courtesy of Scripps Institution of Oceanographty at UC San Diego. Bottom image of the Mauna Loa Observatory is courtesy of NOAA.)
It’s not the first time Madame Pele has interfered with the
science. She also did it in the 1984 Mauna Loa eruption.
“It’s in a bad place,” said Ralph Keeling, a geoscientist
with Scripps Institution of Oceanography at the University of California San
Diego. Ralph is Charles Keeling’s son.
A bad place from a volcanic risk view, but an excellent
place for its unique kind of measurement—gathering atmospheric gas changes in
the mid-pacific at an elevation high above most of the dust and pollutants of
cities and streets.
The Keeling Curve has been a key scientific data point in the discussion of climate change, since carbon dioxide is one of the key atmospheric gases associated with the warming of our planet.
The observatory is operated by the National Oceanic and
Atmospheric Administration.
The latest Keeling reading, Christmas Day 2022, was 419.25
parts per million CO2 in the atmosphere. That’s 50 percent higher than the
level during the start of the Industrial Revolution in the 1800s, and more than
100 points higher than when Keeling first started taking measurements in 1958.
See the actual Keeling Curve measurements and read about the history of the measurement here.
Yeah, and if you add CO2 data from ice cores, that 419.25 is higher than any Christmas since the first Christmas, and indeed, higher than any time in the last 800,000 years. This doesn't bode well.
© Jan TenBrugggencate 2022


No comments:
Post a Comment